
This article is for any middle or high school student doing science fair. It is for the fearful, the motivated, and the future scientists of the world. STOP with the plant experiments – whether it is growing them in different fertilizers, different music, different light, different rooms…enough. It’s boring and who cares. STOP with the egg experiments and submerging them in tea vs milk vs Sprite vs Coke…enough. Try a data science experiment – all you need is a question and a computer. Easy peasy.
Here, I model what a simple data science experiment looks like. In the hopefully not too distant future, I will model a different experiment with a U.S. government dataset found at https://www.data.gov/. The hope is that my ideas can potentially inspire students to develop their own story. All experiments I perform follow the scientific process below:
Question -> Background -> Hypothesis -> Design -> Materials/Procedure -> Data Analytics -> Conclusion -> Error Analysis -> Future Direction
Question
Developing a question is often the hardest part. You don’t need an official brainstorming session to develop one – any question that pops into your head can serve as an inspirational seed. Case in point: The idea for this investigation popped up during a discussion on how the U.S. Postal Service uses image recognition algorithms to sort mail by Zip Code. Can you imagine how long it must have taken for pre-computer era postal workers to sort mail? Then I thought about how I draw a slash in seven, but a lot of people don’t, which made me wonder what makes people choose to write sevens the way they do? So this particular question developed from a fleeting thought in a class – “I wonder if the way people write sevens has anything do with how they feel about math?”.
Background
Here, one needs to write a couple of paragraphs on information or prior research relevant to the project. No need to trek to the library – Internet references are perfectly fine. Even though Wikipedia is one of my best friends and good for initial exposure to a topic, it is better to use a professional source like https://www.scientificamerican.com/, https://www.cdc.gov/, https://www.alz.org/, etc. My research would focus on the relationship between handwriting and academic success.
Hypothesis
I came up with four types of sevens after some serious thought: The naked seven, the hanger seven, the slashed seven, and the slashed-hanger seven are all shown below. The number next to them is a rank of their complexity.
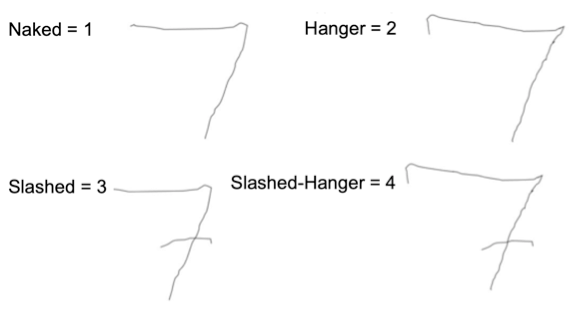
I then generated a hypothesis: the greater the complexity of a person’s seven, the more that person liked math. My hypothesis was based on the logic that the more time people spend drawing a number, the more they must care about numbers, and they more they care about numbers, the more they must like numbers and all that goes with them. Or so I thought…
Design
The experiment consisted of four questions administered through a Google Survey. For this experiment:
- The independent variable, or the one I am interested in investigating, is the complexity of seven.
- The dependent variable, or the variable I am measuring and believe could be a reflection of the independent variable, is feelings about math (1 = Hate, 10 = Love)
- For controls, I added age and gender, objective variables for respondents to answer to ensure the survey worked.
- The survey was kept constant across all respondents and never changed.
Bonus: I added a “Seinfeld variable”, or whether or not people knew that the character George wanted to name his future child Seven. I threw that in because the quiz was titled, “A Tale of Four Sevens”, and it’s always good to add flavor 🙂 https://www.youtube.com/watch?v=NRUdaWZ4FN0.
Materials
The investigation only required a Google Survey, which can be found here: https://forms.gle/BEFopcovUV6LRZLM9.
Procedure
- Generate a Google Survey and spread the word about it.
- Wait a few weeks to accumulate data.
- Observe responses in Google Drive, download the excel spreadsheet, and perform the analysis. On my BioChatter YouTube channel I have gone through my analysis step-by-step in case you need help with the technical analysis (I discuss Google Survey, excel, and RStudio).
Data Analytics
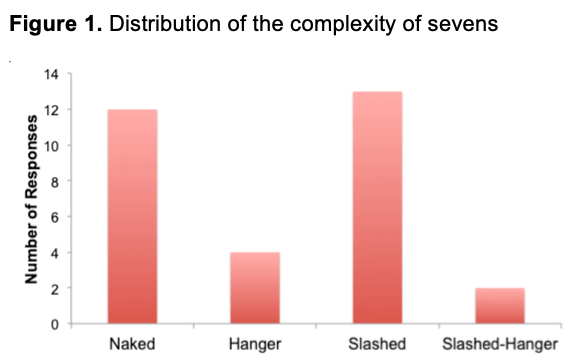
There were thirty-one respondents as shown in Figure 1. Most participants reported that their preferred seven is the seven with a slash. There are two surveys I had to remove because they didn’t answer my control variables – age and gender – making their survey incomplete.
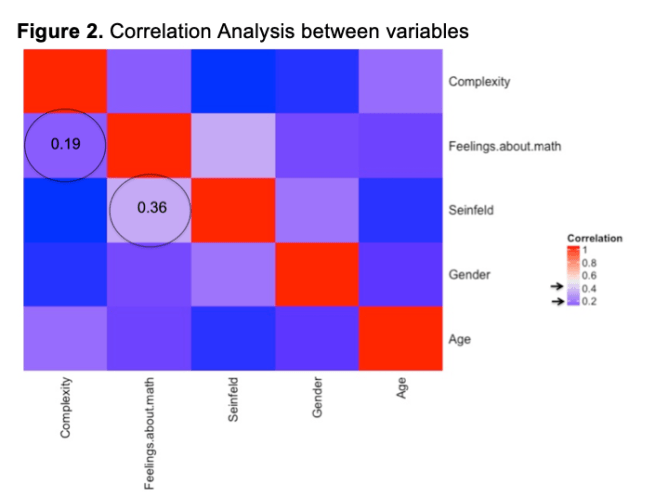
A correlation analysis is shown in Figure 2. Notice the diagonals are red and have a perfect correlation of one, which is to be expected – any variable will perfectly associate with itself. For example, fire vs fire = 100% the same, yin vs yin =100% the same. For this analysis, there were no strong correlations, certainly not the correlation between complexity and feelings about math that I was investigating. However, in the name of science, I had to analyze something, and the most interesting correlation was between Seinfeld and feelings about math with a mild correlation of 0.36.
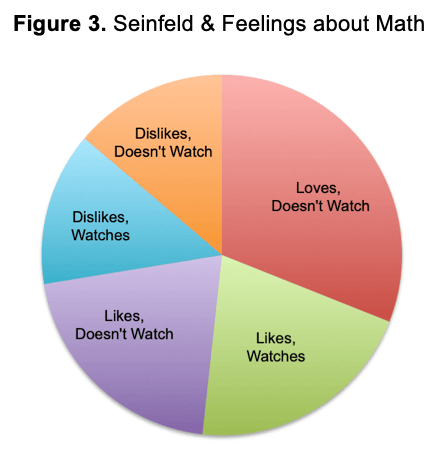
Figure 3 indicates the proportion of respondents regarding the Seinfeld and math variables.
- About 20% were math-likers that watched and about 20% were math-likers that didn’t watch the show.
- About 15% were math-dislikers that watched and about 15% were math-dislikers that didn’t watch.
- About 30% were math-lovers that didn’t watch and 0% were math-lovers that watched.
Knowing that a person LOVES math is a good indicator of their Seinfeld knowledge – they probably don’t watch it. Maybe they don’t watch any TV at all because they are busy studying. Who knows?
Conclusions
The complexity of the respondents’ sevens did not correlate with their feelings about math as I had hypothesized, though the Seinfeld variable had a mild correlation with feelings about math.
Error Analysis
There are several flaws in this experiment. First, it is a stretch to assume that because someone knows a bit of trivia that they watch the show. Second, there were only 31 respondents and not a robust sample size.
Future Directions
For the purposes of this experiment, I changed the continuous variable “Feelings about Math” to categorical data. Loves math = 9-10, Likes math = 6-8, Dislikes math = 1-5. These are arbitrary cutoffs. A better method would be to use a more concrete, objective variable – like give some math questions, grade the accuracy, and divide responses into “As”, “Bs”, etc. The correlation between math and knowledge of Seinfeld could be investigated further by giving a quiz about more than one Seinfeld fact.
Concluding remarks
There is real no value in the results of this particular study, as there is no strong correlation. Yet, the experimental process was precisely followed, so it is indeed a valid study. Such a process can be repeated with any dataset, as long as you have a question and well-defined variables.
I encourage you to develop a survey of your own and give it a try. Then, check your attempt with the rubric below to see how you score. Good luck!
Example rubric for a 3-paragraph conclusion:
Background:
- State the question or problem – 5 points
- Discuss previous research / relevant information – 5 points
- State hypothesis and reasoning – 10 points
Data
- Describe variables, controls, constants – 10 points
- Briefly describe Materials / Procedure – 5 points
- Quantitative Description of the Data (tables and numbers) – 20 points
- Qualitative Description of Data (graphs and visuals)– 20 points
Conclusion
- Results / restate hypothesis – 5 points
- Flaws / Errors – 10 points
- Future Directions– 10 points

