Join Walter Mitty on His Epic Adventure – if you dare

By: Kelly Daescu

Ever had one of those days where you needed a break from social media, homework, and people? I sure have, and I’m so thankful for the captivating story carried by the amazing Ben Stiller and Kristen Wiig.

On those sorts of days, it is really tempting to hide out in your room and avoid humanity, but I challenge you to get a little uncomfortable. Ask your parents to watch “The Secret Life of Walter Mitty” with you, and ask them if they would be willing to put down their phones for one hour and fifty-four minutes. If they say that they are busy, I dare you to persist and wait for when they have a free evening that they can spend with you – trust me it will be worth the wait.

I am throwing down one more gauntlet – if you have that impulse to be by yourself right after you watch it, I encourage you to either:

  1. pick up colorful pens and start journaling at the kitchen table wearing earbuds and listening to your favorite playlist
  2. Going on a walk with your parents in nature
  3. Playing with your dogs, cuddling with your cats, or getting your vitamin D on and basking with your reptiles.

Maybe the reason I love this movie so much is because it reminds me of five of my heroes –

  1. My husband is a native Romanian speaker, and the movie beautifully portrays how hard language barriers can be. It also beautifully portrays how even people speaking the exact same language with the exact same accent can have trouble communicating.
  2. My son is over 20 years younger than me, and we’ve had our fair share of miscommunication. But we always found our way back to each other, even when the stakes were high.
  3. My dad is color blind, and something about the visuals in the movie just speaks to me. In his “zoning out” sequences, the color and camera angles are spectacular.
  4. My older brother is the ultimate carpenter. When we were little he built treehouses and skateboard ramps, and as he has evolved, his creativity has blossomed into a majestic event venue so close to one of my favorite places in the world – the San Antonio RiverWalk.
  5. I have challenged my younger brother lately to get out of his comfort zone just to see what happens, and he still talks to me, so that is awesome! #winning #josabis

I refuse to exclude people from this list because they lack a Y chromosomes, so I am amending this list to include five of my sheroes as well:

  1. My mom has the biggest heart of anyone I know. When Kristen Wiig sings David Bowie, something about that scene reminds me of my amazing mother.
  2. My sister is so strong, courageous, and fearless. When she was in high school, she was the most beautiful dancer I have ever seen, and I worshipped her. As we have aged, our busy lives and responsibilities have distanced us a little, but she will always be my favorite sister! #lol
  3. My step-daughter in law brings bling to every single encounter, and she brightens any room she is in. She sparkles, and I love her so much.
  4. My amazing dog Stella is my shero. When we got our new dog Luna, the family dynamic changed and poor Stella feels a little left out sometimes since Luna is a younger dog with more energy. But our resilient Stella still sparkles and likes to hang out with us, so we are winning.
  5. Today, I was a shero to myself. I won today, and I’m looking forward to another awesome day tomorrow!

Seasons of Life

The first post I made here was over ten years ago, when I had abruptly left teaching before the end of the first semester. My perpetual mood at the time was “question mark”. I didn’t know my next steps and wondered who I would be if not a teacher.

While I am not quite at the same crossroads now – I love my school culture and my students are the best – I still find myself questioning my life choices. As our children are almost completely independent from us, I’m wondering if the life I’m living is enabling me to be a positive role model and servant, which is what I hope; or if it is draining all of my energy so that I am not able to be fully present with my family and friends, which is what I fear.

This school year plopped itself into my existential dilemma, and I’m confident it will help me figure out my next steps. Cheers to diving into life’s opportunities and sticking with commitments, analyzing your impact (qualitatively and quantitatively), then making informed decisions about the future. Taking ownership of life instead of passively rolling with the punches makes me feel powerful, confident, and ready to rally for another school year.

Find the Biochatter podcast on spotify and apple podcasts!

Instead of blogging about all things STEM, I’m going to explore the world of podcasting!

Episode 1: Hashtags

Introduction to Podcasting

Episode 3: Elemental

Halloween flame test lab video here*

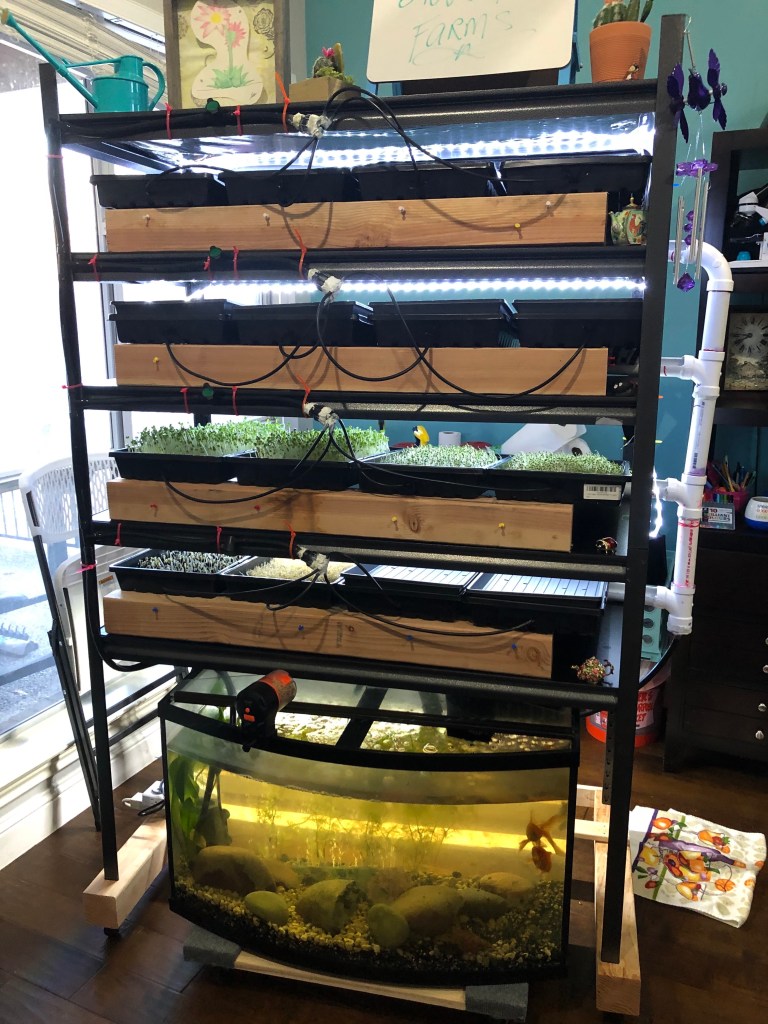
Episode 4: Urban farming

Home system video here*

*Video housed in Google Drive. If you have a gmail account, you have a Google Drive account. On a computer, the link should come up automatically. On your phone, you will have to download the Google Drive app and login (using gmail login) to access video.

endoSeqR: A simple R package to facilitate the identification of endo-siRNAs from small RNA libraries

Abstract

Background: Small RNA libraries are being increasingly generated as RNA-sequencing technology gets more advanced and less expensive. These libraries are often generated to study miRNAs and piRNAs, but there is a population housed within the reads that is often neglected: endogenous short interfering RNA (endo-siRNA). Endo-siRNAs are small non-coding RNAs that regulate gene expression via gene silencing. They exist in both plants and animals, and while endo-siRNA biogenesis may be similar across species, the mechanism of action can be quite different.

Results: This methods paper introduces a user-friendly R package that will identify and characterize endo-siRNA sequences within any small RNA library. The software requires a fasta, fastq, or text file of processed small RNA library reads. Genomic, transcriptomic, and annotated non-coding RNA indexes for several different species are required and available for download. The result is an excel file that reports all identified endo-siRNA sequences and their genomic coordinates. Also included is a function that allows for visualization of the identified endo-siRNAs.

Conclusion: The endoSeqR software package is a tool that will be specifically useful for developmental biologists studying endo-siRNA. The software is open-source on github and available for customization and further development. This pipeline removes known RNA from small RNA libraries, enabling the accurate isolation of endo-siRNAs.

Keywords: endo-siRNA, R package, small RNA libraries

Background

New small RNA libraries are constantly being generated, most of them to study microRNAs (miRNAs) and piwi-interacting RNAs (piRNAs). Both miRNAs and piRNAs are small pieces of RNA about 20-30 nucleotides long that are involved in gene silencing, but they have different mechanisms for biogenesis and activity [1]. For example, miRNAs require the Drosha and Dicer proteins, while piRNAs do not [1]. piRNAs are derived from a single-stranded DNA precursor, while miRNAs come from a hairpin structure [2]. Other characteristics, such as piRNAs being derived from transposons, also segregate the two small RNA species [1].

Endogenous short interfering RNAs (endo-siRNAs) are a third type of small RNA involved in silencing protein-coding genes. They share properties with miRNAs, such as utilizing Dicer, but they are different in that they do not utilize Drosha and involve an RNA-dependent RNA polymerase in some species [1, 3, 4]. Unfortunately, endo-siRNAs are not universally annotated and are identified only by sequence, which impedes scientific progress. A January 9, 2019 PubMed search for the terms “miRNA” and “let-7” (a well-known example of miRNA) returned 1,435 abstracts. Because endo-siRNAs are not named, the only possible way to search for them is to input their nucleotide sequence, which will likely return nothing since abstracts do not link entities to their nucleic acid sequences. While an ambitious effort to provide a universal annotation for endo-siRNAs has been initiated by the endo-siRBase database [5, 6], it has only scratched the surface of all of the existing small-RNA libraries.

The lack of annotated endo-siRNAs poses a technical problem because genomic alignment will not identify or return endo-siRNAs. Thus, in order to effectively isolate endo-siRNAs from small RNA libraries, one has to implement a pipeline involving several different filters. Seasoned researchers who learned these alignment tools as they developed were in pace with technology and may not find a multi-tiered alignment strategy overly complicated. Scientists new to the field, however, require a substantial amount of technical and biological background to fully understand every facet of genomic analysis.

For example, referring to the genome to verify a sequence can be problematic because the reporting of the coordinates is different, depending on the file type [7].
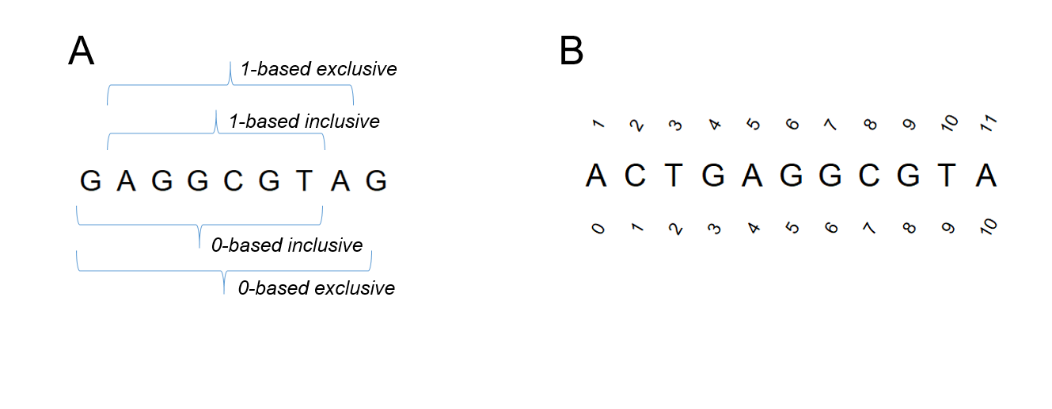
figure1

Figure 1. Coordinate system differences. One issue surrounding genomic analysis is that there are different file formats, and each one has a specific method of assigning coordinates. (A) There are four possible methods to report coordinates. (B) The top label shows 1-based coordinate positions while the bottom numbers indicate the 0-based coordinates.

Genomic files have a specific format that is not consistent (Figure 1). For example, a “sam” genomic file is 1 based, meaning genomic numbering begins with a 1; alternatively, a “bed” genomic file is 0 based, meaning that numbering commences with a 0 [8]. This small detail can unintentionally influence analysis if not considered. For endo-siRNAs, often the length and the first nucleotide is an important characteristic. Caenorhabditis elegans is particularly interesting because endo-siRNAs are generated by an RNA dependent RNA polymerase (RdRP) in a two-step process: the first involves a 26 nucleotide double stranded RNA with a 5’ Guanine (26G) and the second involves a 22 nucleotide double stranded RNA with a 5’ Guanine (22G) [9]. If one were to refer to the coordinates in order to define the length and leading base of an endo-siRNA, there is a likely chance it would be incorrectly labelled if the analyzer was not familiar with the 0-based vs 1-based system. The endoSeqR package is useful because it eliminates any ambiguity: the output excel file is one-based inclusive.

An additional obstacle in genomic analysis is that different aligners have different results reported in their output [10]. The endoSeqR package reduces the burden of scientists so that they do not have to learn to use the variety of alignment tools, much less decipher the tool-specific genomic output.

The endoSeqR package is also useful in that it provides a consistent method for dealing with multi-mapped reads by excluding reads that have over four genomic alignments. A simple method would be to only include unique reads in any analysis; however, excluding multi-mappers can eliminate over 30% of data from small-RNA sequencing runs, resulting in a lack of robustness [11, 12].


Implementation:

The endoSeqR package has a few commands that ultimately produce a file of endo-siRNAs with genomic coordinate and sequence information. The supplementary file is a tutorial that models the process from beginning to end.

The endoSeqR package requires processed reads that, upon import, will be filtered to exclude those that are not 18-28 nucleotides in length. The software has Linux dependencies including bowtie [13], samtools [14], and bedtools (28). It also has R package requirements (openxlsx, plyr, and Biostrings). Several species bowtie indexes have already been generated. They are too large to host on the github repository and are available at https://drive.google.com/drive/folders/16xoPxbzVu9Zo9_gqF16umHO_swB91kxV. Index files include genome, non-coding RNA, and transcriptome indexes for the following species: Mus musculus, Homo sapiens, Drosophila melanogaster, Danio rerio, Caenorhabditis elegans, Arabidopsis thaliana, Sus scrofa, Gallus gallus, and Xenopus tropicalis.

After read import and the removal of reads outside of the 18-28 nucleotide range, a three-tiered alignment is implemented in order to isolate endo-siRNAs (Figure 2). Bowtie, STAR [22], and BWA [24] are tools often used for small RNA library alignment and have the same functionality and ability to customize. Though bowtie is the tool utilized by the package, users that prefer STAR or BWA may manipulate code in the endo_MAP executable found in the open-source version if desired. The fixed bowtie parameters are the following:

-v 1: This specifies global alignment over local alignment in order to exclude soft-clipping. It also allows for one mismatch. endo-siRNAs are perfectly reverse complementary to targets [15], although some studies suggest that this is not always the case [16]. Therefore, one mismatch was chosen to account for any non-canonical endo-siRNAs.

-m 4: This suppresses promiscuous reads that align to the genome more than four times. Genomes have many repetitive sequences such as transposons, and some reads may align hundreds to even thousands of times. Including such reads introduces substantial noise.

-a –best – strata: This reports all top alignments, not just a subset of them (which is the default parameter).

This alignment repeats three times, each time using a different bowtie index. In the first alignment, the reads are mapped to the entire genome and any that have more than four alignments are excluded. For the second alignment, reads are mapped to all annotated non-coding RNA (ncRNA) so that known small RNA can be removed. In the final alignment, remaining reads are then mapped to the transcriptome so that antisense reads can be identified. This is important because endo-siRNAs are reverse complementary to their targets  [15]. Figure 2 outlines the multi-tiered alignment strategy.
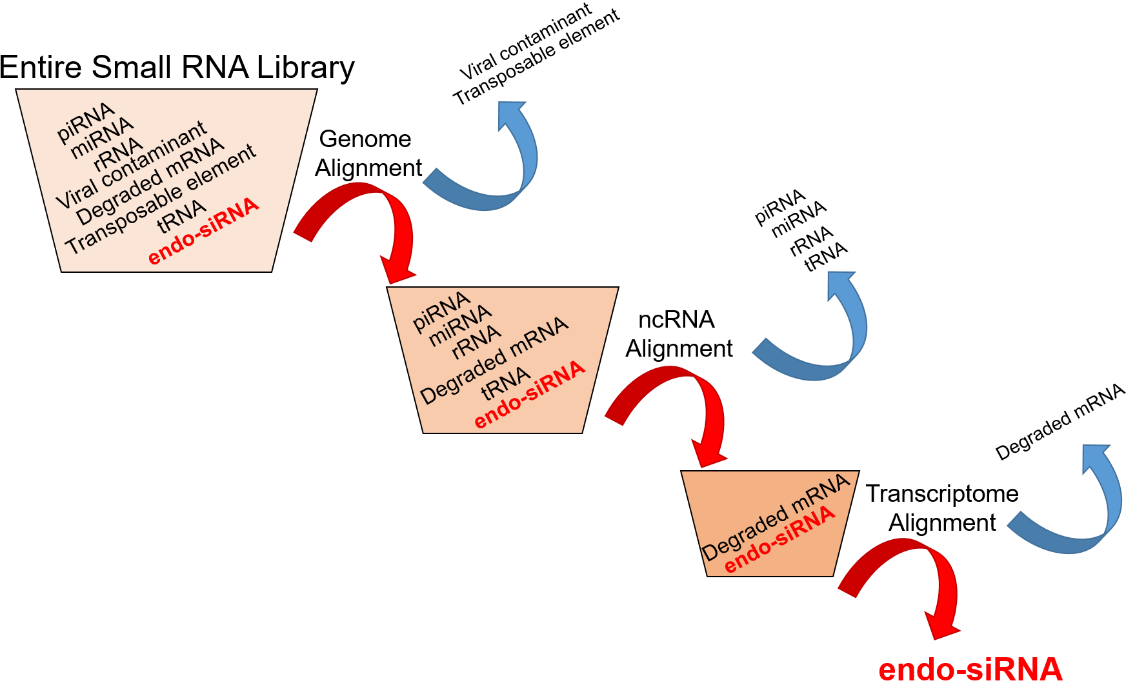
figure2

Figure 2. Software Pipeline. A summary of the endoSeqR alignment process and endo-siRNA identification. Reads from small RNA libraries include different categories of RNA including piRNA, miRNA, ribosomal RNA (rRNA), transfer RNA (tRNA), retrotransposons, contaminants from other organisms, degraded mRNA, and endo-siRNA. The first genomic alignment enables identification and removal of contaminants and repetitive elements. The second alignment is to annotated ncRNA; this enables the removal of any known small RNA such as piRNA and miRNA. The last alignment is to the transcriptome. Sense reads are likely degraded messages and are excluded. The end of the pipeline results in a pure endo-siRNA population.

Eight parent and daughter R functions are found in the “endoSeqR/R/commands.R” document. The majority of the functionality is in the endo_MAP Linux executable, which contains code to implement the three bowtie alignments as well as the necessary samtools and bedtools file manipulations to extract the relevant data. There is an additional Linux executable called clean_up embedded in the Import_endosiRNA R function that removes extraneous files after analysis.


Results:

For an example of software functionality, the  “endoSeqR/practice” folder contains the necessary input files, expected output files, and a pdf tutorial in addition to the dataset-associated publication. The tutorial analyzes a Caenorhabditis elegans small RNA dataset [17]. Only four functions are required for full utility, as shown in supplementary file 1.

The generate_fasta command names the libraries with custom identifiers to simplify analysis. The index files must also be specified, which must either be generated by the bowtie build command or downloaded.

The Import_endosiRNA command will prepare three files: an excel bed file, a more detailed excel file containing sequence and reverse complementary target sequence information in addition to genomic coordinates, and an RData storage file that can be loaded into future R environments with the load command. The file holds the information shown in Table 1.


Table 1. Output File

table1

There is a final command that will produce a data frame containing size and leading base distribution for the population of endo-siRNAs. A histogram can be displayed using the PlotNTLetter command, as shown in the Supplementary tutorial.


Conclusions:

This software is designed for developmental biologists studying endo-siRNA. It is a streamlined procedure that will effectively identify endo-siRNAs in any small RNA library and generate a histogram displaying their length and starting base pair distribution. It will be helpful because in just a few commands, it filters through small RNA libraries in a consistent manner and returns endo-siRNA reads as well as their coordinate and sequence information.


Availability and requirements:

Project home page: https://github.com/kjdaescu/endoSeqR (source code) and https://drive.google.com/drive/folders/16xoPxbzVu9Zo9_gqF16umHO_swB91kxV (indexes and practice dataset)

Programming language: R

Other requirements: Bowtie, samtools, bedtools and R packages plyr, openxlsx, and Biostrings


List of abbreviations:

endo-siRNA endogenous short interfering RNA

miRNA micro RNA

ncRNA non-coding RNA

piRNA piwi-interaction RNA

RdRP RNA dependent RNA polymerase

rRNA Ribosomal RNA

tRNA Transfer RNA

Declarations:

Availability of data and material: Software can be found at https://github.com/kjdaescu/endoSeqR and files can be found at https://drive.google.com/drive/folders/16xoPxbzVu9Zo9_gqF16umHO_swB91kxV. The genomes, non-coding RNA, and transcriptome annotations included were found at ensembl.org. The dataset analyzed is from the following paper:

Asikainen, S., et al., Functional characterization of endogenous siRNA target genes in Caenorhabditis elegans. BMC Genomics, 2008. 9: p. 270.

 

References:

  1. Kim, V.N., J. Han, and M.C. Siomi, Biogenesis of small RNAs in animals. Nat Rev Mol Cell Biol, 2009. 10(2): p. 126-39.
  2. Golden, D.E., V.R. Gerbasi, and E.J. Sontheimer, An inside job for siRNAs. Mol Cell, 2008. 31(3): p. 309-12.
  3. Chapman, E.J. and J.C. Carrington, Specialization and evolution of endogenous small RNA pathways. Nat Rev Genet, 2007. 8(11): p. 884-96.
  4. Piatek, M.J. and A. Werner, Endogenous siRNAs: regulators of internal affairs. Biochem Soc Trans, 2014. 42(4): p. 1174-9.
  5. Daescu, K., endo-siRBase: A multi-species developmental endo- siRNA repository and searchable database, in 8th International Conference on Computational Advances in Bio and medical Sciences (ICCABS). 2018, Institute of Electrical and Electronics Engineers: Las Vegas, NV.
  6. Daescu, K. A multi-species developmental endo-siRNA repository and searchable database. 2018 [cited 2019 January 16]; Available from: http://psirbase.pythonanywhere.com/resource/.
  7. Biostars. Tutorial: Cheat Sheet For One-Based Vs Zero-Based Coordinate Systems. 2018 [cited 2019 January 16]; Available from: https://www.biostars.org/p/84686/.
  8. Group., T.S.B.F.S.W. Sequence Alignment/Map Format Specification. 2018; Available from: https://samtools.github.io/hts-specs/SAMv1.pdf.
  9. Yigit, E., et al., Analysis of the C. elegans Argonaute family reveals that distinct Argonautes act sequentially during RNAi. Cell, 2006. 127(4): p. 747-57.
  10. Biostars. Question: BWA 0.7.12 and Unique reads, -r, -c options, XA: and SA: optional tags on SAM output. 2018 [cited 2019 January 16]; Available from: https://www.biostars.org/p/150063/.
  11. Pantano, L. Handling multi-mapped reads. 2018 [cited 2019 January 16]; Available from: https://seqcluster.readthedocs.io/multi_mapped.html.
  12. Johnson, N.R., et al., Improved Placement of Multi-mapping Small RNAs. G3 (Bethesda), 2016. 6(7): p. 2103-11.
  13. Langmead, B., et al., Ultrafast and memory-efficient alignment of short DNA sequences to the human genome. Genome Biol, 2009. 10(3): p. R25.
  14. Li, H., et al., The Sequence Alignment/Map format and SAMtools. Bioinformatics, 2009. 25(16): p. 2078-9.
  15. Lee, R.C., C.M. Hammell, and V. Ambros, Interacting endogenous and exogenous RNAi pathways in Caenorhabditis elegans. RNA, 2006. 12(4): p. 589-97.
  16. Fischer, S.E., et al., The ERI-6/7 helicase acts at the first stage of an siRNA amplification pathway that targets recent gene duplications. PLoS Genet, 2011. 7(11): p. e1002369.
  17. Asikainen, S., et al., Functional characterization of endogenous siRNA target genes in Caenorhabditis elegans. BMC Genomics, 2008. 9: p. 270.
A Tale of Four Sevens: A Simple Science Fair Data Science Project

This article is for any middle or high school student doing science fair. It is for the fearful, the motivated, and the future scientists of the world. STOP with the plant experiments – whether it is growing them in different fertilizers, different music, different light, different rooms…enough. It’s boring and who cares. STOP with the egg experiments and submerging them in tea vs milk vs Sprite vs Coke…enough. Try a data science experiment – all you need is a question and a computer. Easy peasy.

Here, I model what a simple data science experiment looks like. In the hopefully not too distant future, I will model a different experiment with a U.S. government dataset found at https://www.data.gov/. The hope is that my ideas can potentially inspire students to develop their own story. All experiments I perform follow the scientific process below:

Question -> Background -> Hypothesis -> Design -> Materials/Procedure  -> Data Analytics -> Conclusion -> Error Analysis -> Future Direction

Question

Developing a question is often the hardest part. You don’t need an official brainstorming session to develop one – any question that pops into your head can serve as an inspirational seed. Case in point: The idea for this investigation popped up during a discussion on how the U.S. Postal Service uses image recognition algorithms to sort mail by Zip Code. Can you imagine how long it must have taken for pre-computer era postal workers to sort mail? Then I thought about how I draw a slash in seven, but a lot of people don’t, which made me wonder what makes people choose to write sevens the way they do? So this particular question developed from a fleeting thought in a class – “I wonder if the way people write sevens has anything do with how they feel about math?”.

Background

Here, one needs to write a couple of paragraphs on information or prior research relevant to the project. No need to trek to the library – Internet references are perfectly fine. Even though Wikipedia is one of my best friends and good for initial exposure to a topic, it is better to use a professional source like https://www.scientificamerican.com/, https://www.cdc.gov/, https://www.alz.org/, etc. My research would focus on the relationship between handwriting and academic success.

Hypothesis

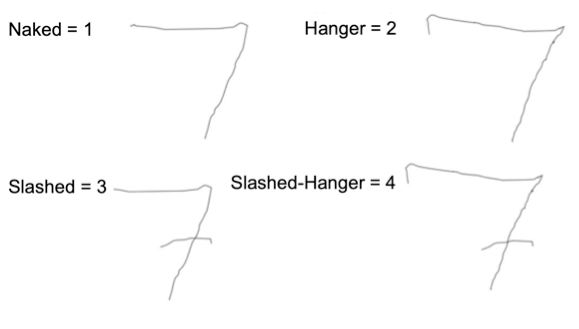
I came up with four types of sevens after some serious thought: The naked seven, the hanger seven, the slashed seven, and the slashed-hanger seven are all shown below. The number next to them is a rank of their complexity.

Screenshot 2019-03-31 17.54.55

I then generated a hypothesis: the greater the complexity of a person’s seven, the more that person liked math. My hypothesis was based on the logic that the more time people spend drawing a number, the more they must care about numbers, and they more they care about numbers, the more they must like numbers and all that goes with them. Or so I thought…

Design

The experiment consisted of four questions administered through a Google Survey. For this experiment:

  • The independent variable, or the one I am interested in investigating, is the complexity of seven.
  • The dependent variable, or the variable I am measuring and believe could be a reflection of the independent variable, is feelings about math (1 = Hate, 10 = Love)
  • For controls, I added age and gender, objective variables for respondents to answer to ensure the survey worked.
  • The survey was kept constant across all respondents and never changed.

Bonus: I added a “Seinfeld variable”, or whether or not people knew that the character George wanted to name his future child Seven. I threw that in because the quiz was titled, “A Tale of Four Sevens”, and it’s always good to add flavor  🙂 https://www.youtube.com/watch?v=NRUdaWZ4FN0.

Materials

The investigation only required a Google Survey, which can be found here: https://forms.gle/BEFopcovUV6LRZLM9.

Procedure

  • Generate a Google Survey and spread the word about it.
  • Wait a few weeks to accumulate data.
  • Observe responses in Google Drive, download the excel spreadsheet, and perform the analysis. On my BioChatter YouTube channel I have gone through my analysis step-by-step in case you need help with the technical analysis (I discuss Google Survey, excel, and RStudio).

Data Analytics

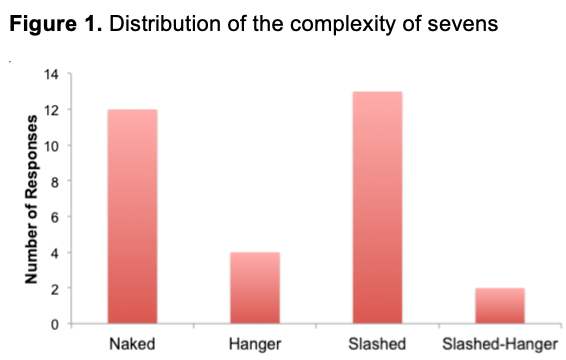
There were thirty-one respondents as shown in Figure 1. Most participants reported that their preferred seven is the seven with a slash. There are two surveys I had to remove because they didn’t answer my control variables – age and gender – making their survey incomplete.

Screenshot 2019-03-31 17.54.13

Screenshot 2019-03-31 17.54.46

Screenshot 2019-03-31 17.54.36

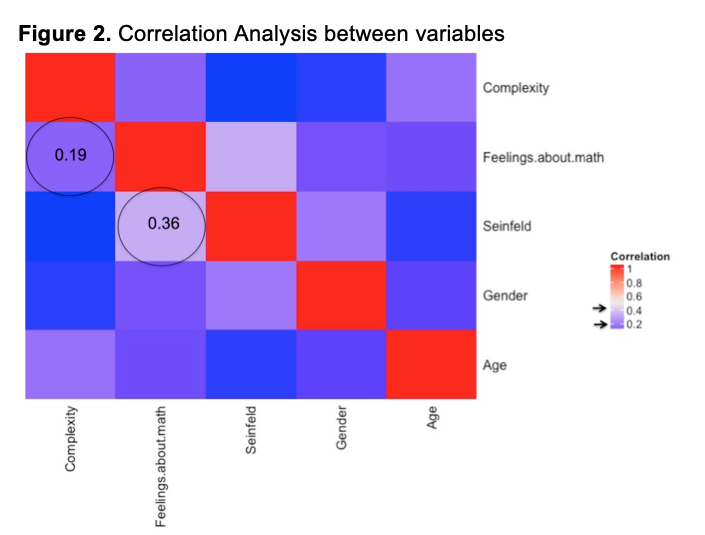
A correlation analysis is shown in Figure 2. Notice the diagonals are red and have a perfect correlation of one, which is to be expected – any variable will perfectly associate with itself. For example, fire vs fire = 100% the same, yin vs yin =100% the same. For this analysis, there were no strong correlations, certainly not the correlation between complexity and feelings about math that I was investigating. However, in the name of science, I had to analyze something, and the most interesting correlation was between Seinfeld and feelings about math with a mild correlation of 0.36.

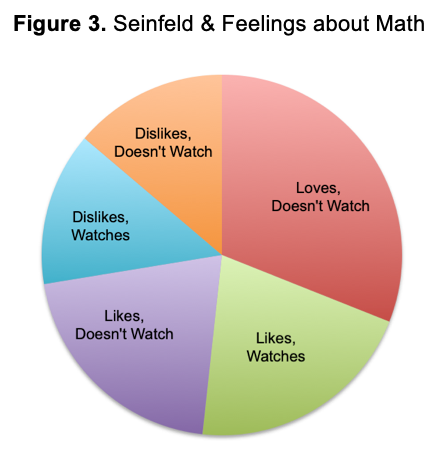
Figure 3 indicates the proportion of respondents regarding the Seinfeld and math variables.

  • About 20% were math-likers that watched and about 20% were math-likers that didn’t watch the show.
  • About 15% were math-dislikers that watched and about 15% were math-dislikers that didn’t watch.
  • About 30% were math-lovers that didn’t watch and 0% were math-lovers that watched.

Knowing that a person LOVES math is a good indicator of their Seinfeld knowledge – they probably don’t watch it. Maybe they don’t watch any TV at all because they are busy studying. Who knows?

Conclusions

The complexity of the respondents’ sevens did not correlate with their feelings about math as I had hypothesized, though the Seinfeld variable had a mild correlation with feelings about math.

Error Analysis

There are several flaws in this experiment. First, it is a stretch to assume that because someone knows a bit of trivia that they watch the show. Second, there were only 31 respondents and not a robust sample size.

Future Directions

For the purposes of this experiment, I changed the continuous variable “Feelings about Math” to categorical data. Loves math = 9-10, Likes math = 6-8, Dislikes math = 1-5. These are arbitrary cutoffs. A better method would be to use a more concrete, objective variable – like give some math questions, grade the accuracy, and divide responses into “As”, “Bs”, etc. The correlation between math and knowledge of Seinfeld could be investigated further by giving a quiz about more than one Seinfeld fact.

Concluding remarks

There is real no value in the results of this particular study, as there is no strong correlation. Yet, the experimental process was precisely followed, so it is indeed a valid study. Such a process can be repeated with any dataset, as long as you have a question and well-defined variables.

I encourage you to develop a survey of your own and give it a try. Then, check your attempt with the rubric below to see how you score. Good luck!

Example rubric for a 3-paragraph conclusion:

Background:

  • State the question or problem – 5 points
  • Discuss previous research / relevant information – 5 points
  • State hypothesis and reasoning – 10 points

Data

  • Describe variables, controls, constants – 10 points
  • Briefly describe Materials / Procedure – 5 points
  • Quantitative Description of the Data (tables and numbers) – 20 points
  • Qualitative Description of Data (graphs and visuals)– 20 points

Conclusion

  • Results / restate hypothesis – 5 points
  • Flaws / Errors – 10 points
  • Future Directions– 10 points

RIP Paul Allen

Today, I want to pay tribute to Paul Allen, The Allen Brain Institute Titan.

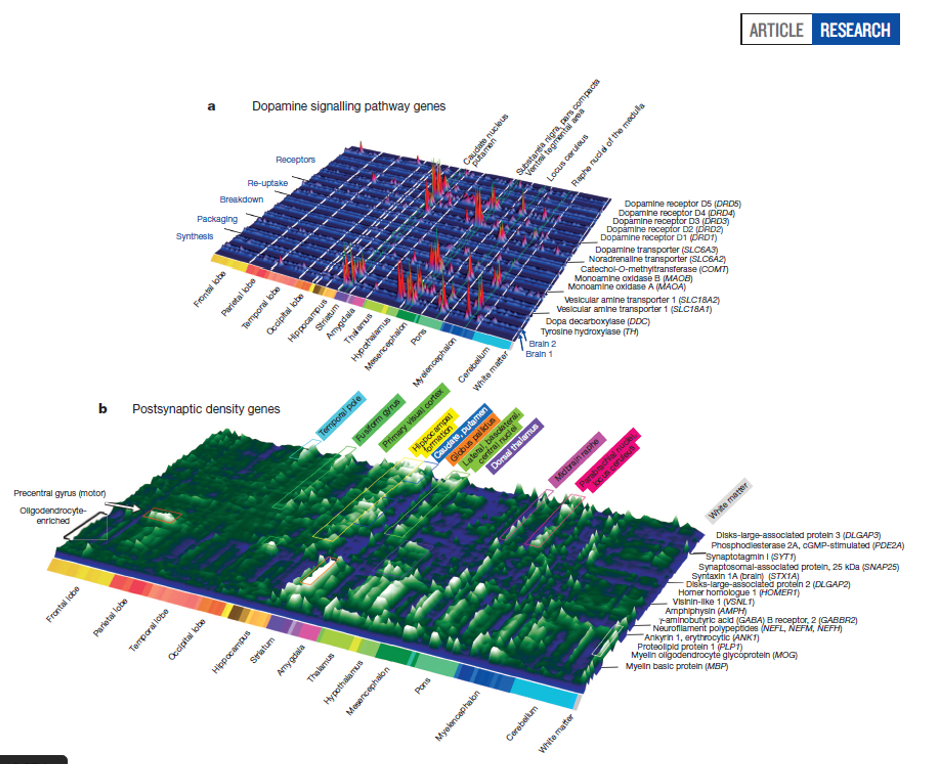
Paul’s vision and insight hit me after I read a paper published by the Allen Institute in 2012 (An anatomically comprehensive atlas of the adult human brain transcriptome). I read so many papers in a day, then file them in a folder I can easily access later; only a few a week actually get printed so that I can fully digest them (I am old school and prefer the printed word). Taking a minute to think about the dynasty this man initiated made me realize that my career switched from worm development to Alzheimer’s Disease pretty much because I fell in love with this picture:

landscape

This expression landscape, the product of many brilliant minds, still fascinates me. Being able to visually display such complex data is the beginning of conversations that will change the face of science.

I offer my deepest condolences to all he touched, and my sincere gratitude as well. You have helped me grow tremendously as a scientist, and I am so very thankful.


My evolution: from teaching to programming

Three years ago I was a high school science teacher and curriculum writer with no programming experience. This weekend I finished developing a software that I am going to present at a computational biology conference in a few weeks. The last three years completely changed  the trajectory of my career, and now that I have finished a single author paper that has consumed a tremendous amount of brainpower, I finally have the chance to sit down and blog – something I haven’t done since I started school.

Looking back to my first post in December of 2015, I am reflecting on the person I was then; a woman who loved teaching science but left the field in order to pursue a more technical career. From then until mid-2016, I started a business and worked from home, and my posts pretty much speak for themselves; my business started with curriculum writing but blossomed into medical blogging, writing test prep material, and science editing. I was doing all sorts of science consulting from the comfort of my own home.

I haven’t written since then because I returned to graduate school in order to gain skills that would help me in my business, which I thought was going to be easy because I already had a Master’s degree in biochemistry and molecular genetics; but molecular biology today is light years away from the molecular biology of 15 years ago.

Back then, I was attending graduate school right about the time when the human genome project ended. I worked in a breast cancer lab and did traditional lab work.

Fast-forward to 2016. I was ready to pick up where I left off and started working in a lung cancer lab. I kept hearing about the Cancer Genome Atlas (TCGA) which contains sequencing information for nearly 40 different types of cancer. Expression, genomic, and clinical data from thousands of patients can be accessed at firebrowse.org.

Once I found this goldmine of information, I devoted all of my time to analyzing TCGA data. For me it was a no brainer because patient data was far more valid then anything I could generate within a petri dish or test tube. Sure, there are many confounding variables that are hard to control when using patient data; however, the large sample sizes alleviated my reservations, so I jumped in.

Soon I expanded my data analytics from cancer to regulatory processes. While conducting research for a C. elegans (worm) lab, I was generating thousands of lines of code, and as I got more experienced, I spent enormous amounts of time writing functions to simplify my code. It was addictive – every time investment I made, I simplified some process so that something else became easier. Soon I had so many custom functions that I decided to publish an R package.

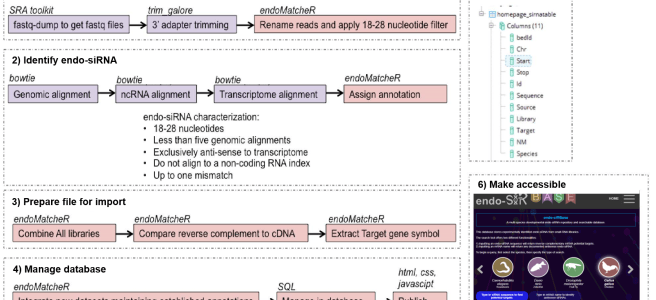
The details of my program can be found in my paper and are shown in the pipeline in the featured image, but what I am most proud of is that by initiating a collaboration with the computer science department, I was able to provide a tool that will help a lot of developmental biologists.

As this project closes, I am an author on another two papers that are being reviewed. One is on Prostate Cancer and the other is on Alzheimer’s Disease. I feel like the last two years of my life were spent gaining a variety of skills and knowledge, and the next two years are going to be spent focusing on my dissertation and applying them.

Until then…

Picture3.png


Mind-Control

http://www.gizmag.com/mind-controlled-prosthetic-fingers/41886/

Kelly Daescu

Scientists have generated a robotic hand that can move simply by the wearer willing it to. This is astonishing considering that the nervous system operates with such a great deal of precision and complexity. The existence of a device that can hijack our body’s electrical impulses seems like the plot of a science fiction movie.

Authentic nervous system signaling is driven by neurons that look like an electrocuted cell, coincidentally enough. Their cell bodies contain organelles like the nucleus, mitochondria, and ribosomes, and their cell membranes have a multitude of jagged projections called dendrites. Because dendrites detect extracellular activity, neurons have many in order to maximize sensation detection.

While dendrites are the message receivers and there are many, axons are message deliverers, and most neurons only have one. Axons are insulated wires surrounded by myelin sheaths that amplify the nerve impulse. The ultimate destination of an action potential is the synapse where neurotransmitters are released from the axon and received by dendrites of a neighboring cell.

Neurotransmitter secretions explain nervous system communication, but they don’t explain how the communication is initiated: the action potential. The action potential is an all or nothing response that is only executed when the cell membrane’s polarity changes due to a sodium ion influx and potassium ion out flux via the sodium potassium pump.

In an extraordinary accomplishment, scientists have found a way to circumvent this neural relay race into one single step using a computer-programmed prosthetic arm. The mind-controlled prosthetic was programmed based on brain mapping data that identified regions responsible for motor output and sensory input.

To obtain a brain map, scientists implanted electrodes into a patient’s brain and asked the patient to move his hand while simultaneously monitoring his brain’s electrical activity. This allowed them to identify specific regions involved in motor output. The same patient was later given a glove equipped with tiny vibrators. As different regions of the hand were stimulated, regions of the brain that received the sensory input were recognized. By elucidating the hand’s motor and sensory regions, scientists held the key to develop a mind-controlled device.

The device they engineered was a prosthetic arm connected to the brain by wires with electrodes. The prosthetic was programmed so that its movements were a function of the position-dependent electrode activation in the brain. With 76% efficiency, the individual could successfully move his hand. The efficiency increased to 88% if the pinkie and ring fingers were splinted together since those regions in the brain overlap.

The overwhelming success of this prosthetic device proves that Luke Skywalker’s mind-controlled hand no longer exists in only galaxies far, far away. In fact, neuroscience, computer science, and bioengineering research advancements continue to legitimize science fiction.

Nerd Alert

My last post was a while ago, and it is because business is simply booming.  I haven’t been able to write as much because I have been living in the library researching in order to complete projects for my clients.  When I’m not in the library I am at home, and my cats now literally sit on my lap while I type.  And yes, I am not afraid to admit that I am a nerd and a cat lady.  The good news is that I am loving every minute of it.

Due to the diversity of experience I’ve been accumulating, I’ve decided to branch out in my blogging.  I changed the focus of the blog to “Science News and Communications” because it isn’t just going to be about biology anymore, and it isn’t just going to be about teaching.  From now on, I will just write from time to time when business is slow on whatever subject my heart desires.

The past few months, I’ve learned so much as I’ve been researching and writing.  Here are a few of my favorites.

  • Astronomy: Tracing lineage is not as easy as one might think, but as far as I can tell based on names, dates, locations, and family histories, there’s a strong possibility I am distantly related to the guy who invented the radio telescope.  Even though Karl Jansky was such a big deal (he has a unit of measurement named after him), nobody knows about the guy.  So, I didn’t include him in my project.  I thought about it because writing about nebulas, black holes, and planets is really interesting, but I also wanted to make it “down-to-Earth” (pun intended).  Instead of the radio telescope, my proverbial pen veered into the history of NASA.  As I was reading, I remembered that NASA began pretty much as a flex to Russia during the cold war.  It isn’t a coincidence that Sputnik launched in 1957 and NASA opened its doors in 1958.  The coolest thing I discovered in my research was that Neil Armstrong’s words when he stepped foot on the moon in 1969 were misquoted (in 1969 they had more static I guess).  He actually said, “That’s one small step for [a] man, and one giant leap for mankind”.  The inclusion of that one letter “a” that was always left out totally changes its meaning for me.  It makes it more personal.  It links how just one action, one moment, one man, can change history.
  • Geology: In researching igneous rocks, moon phases, and earthquakes, my favorite part of the whole project was simply learning about clouds again.  One of the beauties of freelancing is that I get to walk my son home from school every day.  On a few of these walks, we played the game “name that cloud” until he got sick of it.  So then I tried to change it to “name the shape in the cumulus cloud”.  He got sick of that too.  I, for one, am not sick of it, and on my own walks and runs I still play – is that a cirrus cloud?  Cumulostratus?  Nimbus?  The only one I can get consistently is fog.
  • Surgical Procedures: Tailbone removal (coccygectomy) is actually a thing because some people have chronic pain to the point where surgery is their best option.  I’m so ambivalent about my tailbone, but indeed I remember hurting it like crazy as a kid when I landed on it wrong, so I can see why this procedure came about.  I had no idea such a procedure even existed before two weeks ago.  I’ve learned about so many medical procedures and new technology from these assignments that I had never known about.  Absolutely fascinating.
  • Quantum physics: This was the hardest project I have done so far.  I know all about electrons and their duality; they behave as particles while also behaving as light waves.  I was really confident going in because I am solid on atomic theory and structure.  However, this project went far beyond what I had expected and into the realm of Calculus.  It has been a while since I have taken an advanced math class.  Ay Caramba!  I actually had to watch MIT lectures on wave functions so that I could relearn it before writing about it.  I finished that 50 page monster today.

More to come…


Ecology and Problem-Based Learning

A typical ecology calendar looks like this:

  • Day 1: Food chains, webs, and trophic levels
  • Day 2: Organism niches and pyramids
  • Days 3-4: Carbon and Nitrogen Cycles
  • Days 5-6: Symbiosis
  • Day 7: Predator-Prey
  • Day 8: Ecological Succession
  • Day 9: Review
  • Day 10: multiple choice assessment

Paradigm shifting this traditional scope and sequence into a problem-based learning unit fosters student problem solving, independence, and engagement and can provide a meaningful learning experience if done correctly.  This post provides a roadmap to implementing an effective problem-based ecology project, and a successful project starts with a high functioning group.

Grouping:

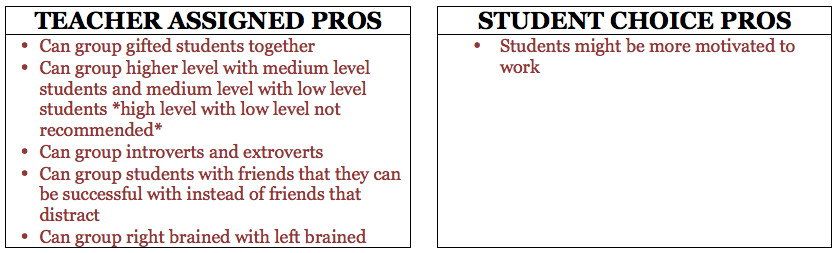
When I was a new teacher I never assigned groups because students practically formed them on their own the minute I said “project”.  Over time I learned that being deliberate about creating groups results in higher quality projects and more positive learning experiences.  The key to designing successful groups is to be intentional.  There is a school of thought that student choice is an integral part of learning, and while I agree that is true in some cases, I strongly believe that the benefits of teacher-assigned groups far outweigh those of student-chosen groups.

W

Transitioning from “Ecology Unit” into “Ecology Problem”  

Day 1: Ecology Introduction and Problem Assignment

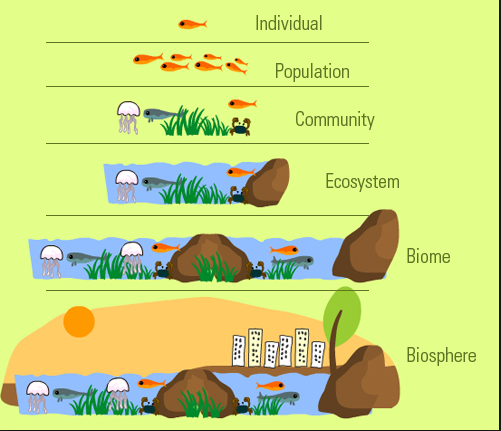
Introduce ecology by discussing the hierarchy of organization as seen in the picture below.  Ecosystems include more than just organisms, they  also include abiotic factors such as carbon, nitrogen, water, rocks, etc.

s

After the brief ecological hierarchy introduction, hand out envelopes to each team labeled “NASA: Operation Mars”

The envelopes should contain a piece of paper with the following explanation:

Mission

Your team is working for NASA to develop a plan for creating a city the size of Los Angeles that can sustain life on Mars.  NASA has contracted the project out to several ecology firms.  They want small firms to generate ideas then collaborate with other elite firms in ongoing summits.

**It is always fun to throw in pop culture, and this trailer can add a little humor before students get started.  Use discretion, it has one explicative.**


In the folder they will need the project schedule as shown below.  Note that it is ten days long, just as a traditional ecology unit would be.  There are research summits incorporated which provide an opportunity for work-checking, feedback, and instruction.  These summits are critical for scaffolding and making sure students are solid on the foundation before moving on to harder concepts.  I will discuss summit format after describing the project details.

 Student Project Schedule (sheet given to students)

Day 1:  In order for life to form, abiotic cycles such as the carbon and nitrogen cycle must be established.  Make diagrams of each cycle and be able to present ALL important vocabulary involving actions that remove the elements from the atmospheric bank and actions that return elements to the atmospheric bank.

Upon completion, you must discuss primary succession and describe why the abiotic cycles are necessary for it to occur.  Describe and discuss pioneer species and give several examples.  Describe and discuss the progression of trophic levels and a climax community.

Day 2:  Now that a climax community is established, describe every trophic level and organism niches in each level (include 20 organisms, keeping in mind that the goal is an urban ecosystem).  Include vocabulary such as decomposer, carnivore, secondary consumer, etc, and be sure to give several examples of each.  Each organism should be associated with at least two vocabulary words.

Design and illustrate three food chains with four trophic levels.  One food chain must be converted to a pyramid of energy, one food chain must be converted to a pyramid of numbers, and the final food chain must be converted to a pyramid of biomass.  Most pyramids will be in the typical triangle shape, although pyramid of numbers and biomass may not be.

Describe why energy pyramids must always be in the typical triangle shape and why numbers and biomass pyramids might look differently.  Make sure that one of your pyramids has an atypical shape and explain why it looks differently.

Day 3: Research Summit

Day 4: Food chains are a simplistic view of predator-prey relationships.  Food webs are much more complex and show all community predator-prey relationships.  Design and illustrate a detailed food web in the ecosystem that has at least 4 producers, 6 primary consumers, 4 omnivores, and 2 tertiary consumers.

Describe and give examples of decomposers, scavengers, and detritivores.  Are they shown in food chains and webs?  Why or why not?

Describe the 10% rule and the reason for it as well as its significance.

Finally, pick a predator-prey relationship and illustrate a 20 year predator-prey graph.  Describe the trends in the graph.

Day 4: Research Summit

Day 5: Food chains and webs show predation, but don’t show the other community interactions including competition and symbiosis (mutualism, parasitism, and commensalism).  Describe two examples of each type of interaction in the community that you developed.

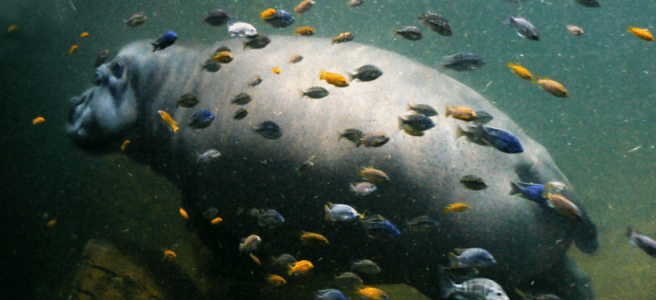
Just for fun, here are my favorite mutualism and parasitism clips.  Each one has some great higher level questions that can be used in summits.  

Regarding the mutualism clip – there is also a commensalism relationship shown.  What is it? (dung eaters don’t benefit hippo like the fish that clean it do)

Regarding the parasitism clip – how is parasitism similar and different to predation? (both parasites and predators kill, but parasites live on large hosts and feed on it without necessarily killing it)

Day 6:  A human brings DDT to the community in order to ensure better crop growth.  Discuss DDT – what is it, why is it harmful, and relate it to biomagnification and the term “biodegradable”.  Discuss other potential sources of biomagnification.

Discuss what would occur if the whole community was burned in a fire in terms of secondary succession.  What could be some other causes for secondary succession?

Day 7: Research Summit

Days 8-10: Final Proposal and Commercial

At this point, students have been exposed to all the targets regarding ecology and have had the opportunity for feedback and discussion.  Their job now is two-fold.

  1.  They need to create a comprehensive proposal discussing each task with an array of images.  It needs to be typed, bound, and beautiful.  The project must be complete at the end of class on day 9 so that on day 10 the teacher can visit with individual groups.
  2. They need to create a commercial to woo people to populate Mars.  Their commercial should highlight their ecosystem and fun things to do and generally convince people to leave Earth. The clip below might be good to show to give them some ideas.  An activity like this emphasizes ecology content while building technology skills.


Teacher notes

Problem-based units are different in that they are completely lacking any teacher large group instruction as well as lacking pencil and paper tests.  To effectively facilitate such a project, summits are critical for student understanding.

Summits

A summit should almost look like a socratic seminar.  It will look similar in that the whole class should be in a circle and it should be question based.  Teachers can still be the moderator and “grade” participation by keeping track of student contributions.  It will be different in that the teacher will lead the seminar via image analysis as opposed to philosophical questioning.  For example, perhaps an aquatic food web will be shown on the overhead.  The teacher can ask the large group, “Explain two facts or inferences about this picture”.  Students will raise their hands and sequentially discuss the diagrams in detail and bounce questions off of each other.  Discussion can go on for 10-15 minutes per diagram, and the teacher should serve as a facilitator (as opposed to a fountain of knowledge) while keeping track of time.  The students must educate each other and clarify the project with other “experts” at the summit who are performing the same task.  This exercise involves analysis with unfamiliar images of food webs, chains, trophic levels, abiotic cycle images, etc. and will stretch student thinking.

Teacher notes: Grading

For grading, I recommend 2 daily grades and a test grade.

Daily grades:

  1.  Summit Participation (5 or so meaningful contributions per summit for full points)
  2. On day 10, in teacher individual group visits, ask group members (at random) ten questions regarding their project.  For any questions that they cannot explain, deduct ten points.

Test grade:

A simple rubric like this will make your life much easier than taking the time to grade every single word and detail.  You can develop your own or there are TONS of rubrics and resources on making rubrics on the internet.

Screenshot 2016-03-01 14.16.20 copy

Problem-based learning can be incorporated into any unit.  As I’ve shared in other posts, I absolutely believe in the lecture/student-note model of learning, but problem-based learning is just as powerful.  A classroom that incorporates both is serving our students best by equipping them with a variety of skills.